Written by: Ruslana
Published: September 2025
Investors have probably seen every TAM stat on the planet. But what they haven’t seen is your path through it. That’s what the market size slide is for: not just to show how big the space is, but to prove you know where the real, reachable opportunity lives.
In this guide, we’ll show you how to turn market size into a smart, fundable story. You’ll see what makes a sizing slide land, how to avoid the common traps, and which market sizing examples actually get VCs to lean in.
What is a market size slide (and why investors care)?
The market size slide (also called the TAM-SAM-SOM slide or market overview slide) presents the estimated revenue potential of the market in which a company operates. It illustrates how large the market is, how fast it’s growing, and what portion the company aims to capture.
This is where you stop telling a story and start showing the numbers. This slide answers the question: Is this a market worth betting on?
Unlike the market opportunity slide, which focuses on the unmet need or market gap your startup addresses, the market size slide is a cold, hard dose of how big. It’s often what investors zero in on first to determine whether your business has unicorn potential or just a niche hustle.
How to size your market the right way?
Before you design the slide, you need to run the numbers. Market sizing is less about impressing VCs and more about understanding your own playing field.
There are two core ways to build a strong market sizing case: bottom-up and top-down.
Let’s have a look at each:
⬆️ Bottom-up market sizing
When using the bottom-up approach, you start from the ground level – what you can actually capture in the near term – and build upward. You begin with your SOM (Serviceable Obtainable Market) based on product pricing, target customer segments, and realistic adoption assumptions. From there, you can expand to your SAM or even extrapolate toward TAM if you have the data.
Example:
- $20/month subscription × 150,000 target users = $36M SOM
Why investors trust it: It’s execution-first. You’re not just pointing to a big market, you’re showing exactly how you’ll carve out your share, backed by math and GTM logic.
⬇️ Top-down market sizing
The top-down approach starts with the big picture. You take a large, industry-wide number (usually sourced from market research firms like Statista, McKinsey, or IBISWorld) and then narrow it down by geography, vertical, customer type, or use case to get to your SAM and SOM.
Example:
- $50B global pet care industry → $8B urban pet tech segment → $300M in app-based services for pet owners
Best for: Established industries with strong third-party data and clear market segments.
Top-down works well for setting the stage, but without bottom-up logic or traction, it can come across as surface-level. Always pair it with context or assumptions that show how your startup fits inside that number.
How to craft a winning market size slide
Once you’ve done the math, your next job is turning it into a clear, persuasive slide. There’s no single format, but most effective pitch deck market size slides use the following approaches:
1. TAM-SAM-SOM: the investor favorite
This classic model segments your market into:
- TAM (Total Addressable Market): The full market demand for your product.
- SAM (Serviceable Available Market): The portion of TAM you can target with your offering.
- SOM (Serviceable Obtainable Market): The part of SAM you can realistically capture soon.
Crafting a TAM/SAM/SOM slide works best for clear markets with identifiable users and revenue pathways.
Here’s a TAM/SAM/SOM market sizing example:

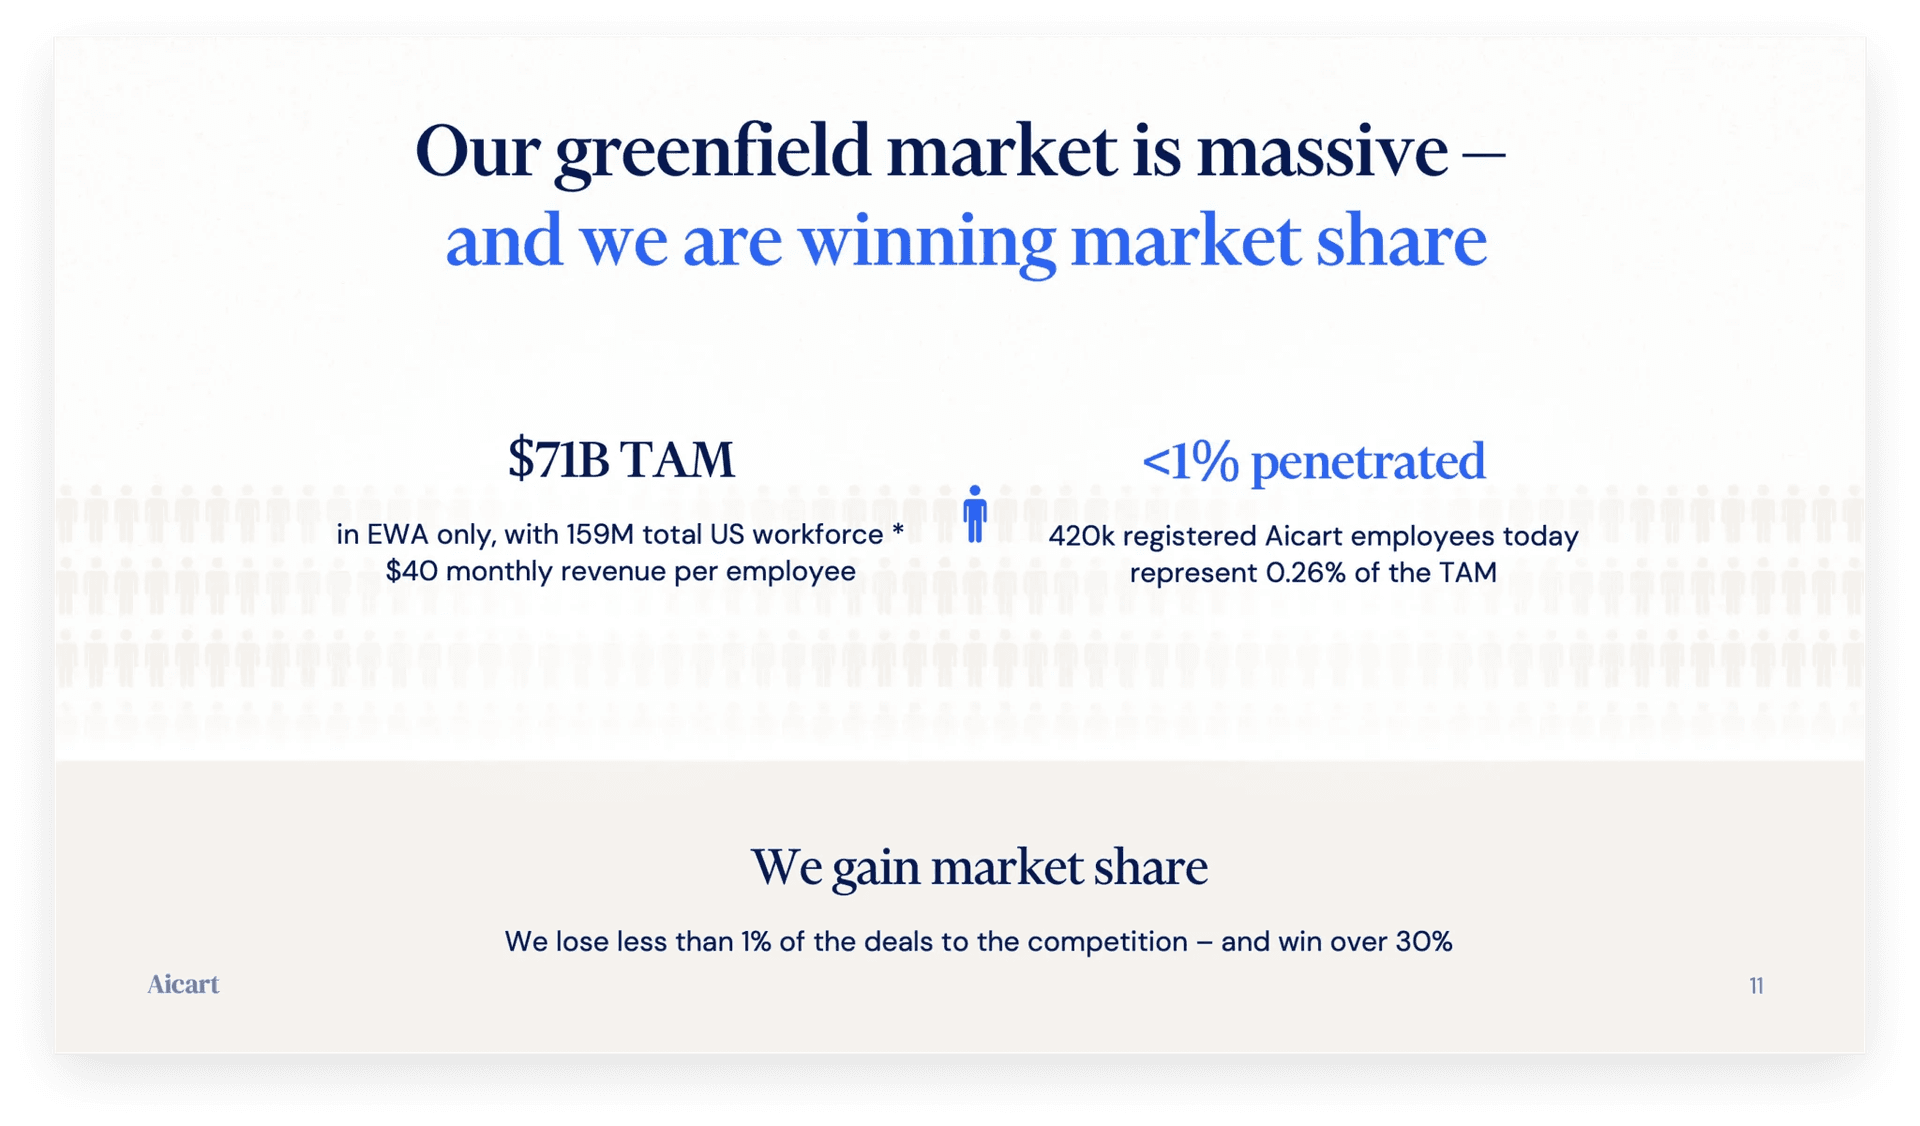
2. Greenfield sizing: for emerging markets
When you’re creating a category or playing in a market with no reliable benchmarks, you’ll need to build your case from proxies, behaviors, and traction.
This approach uses:
- Comparable industry segments
- Customer behavior trends
- Early traction (pre-orders, waitlists, pilots)
This approach works because it shows vision and realism, which is critical for early-stage innovation. Thus, it’s a great shot for startups entering nascent, rapidly evolving industries.
For example:
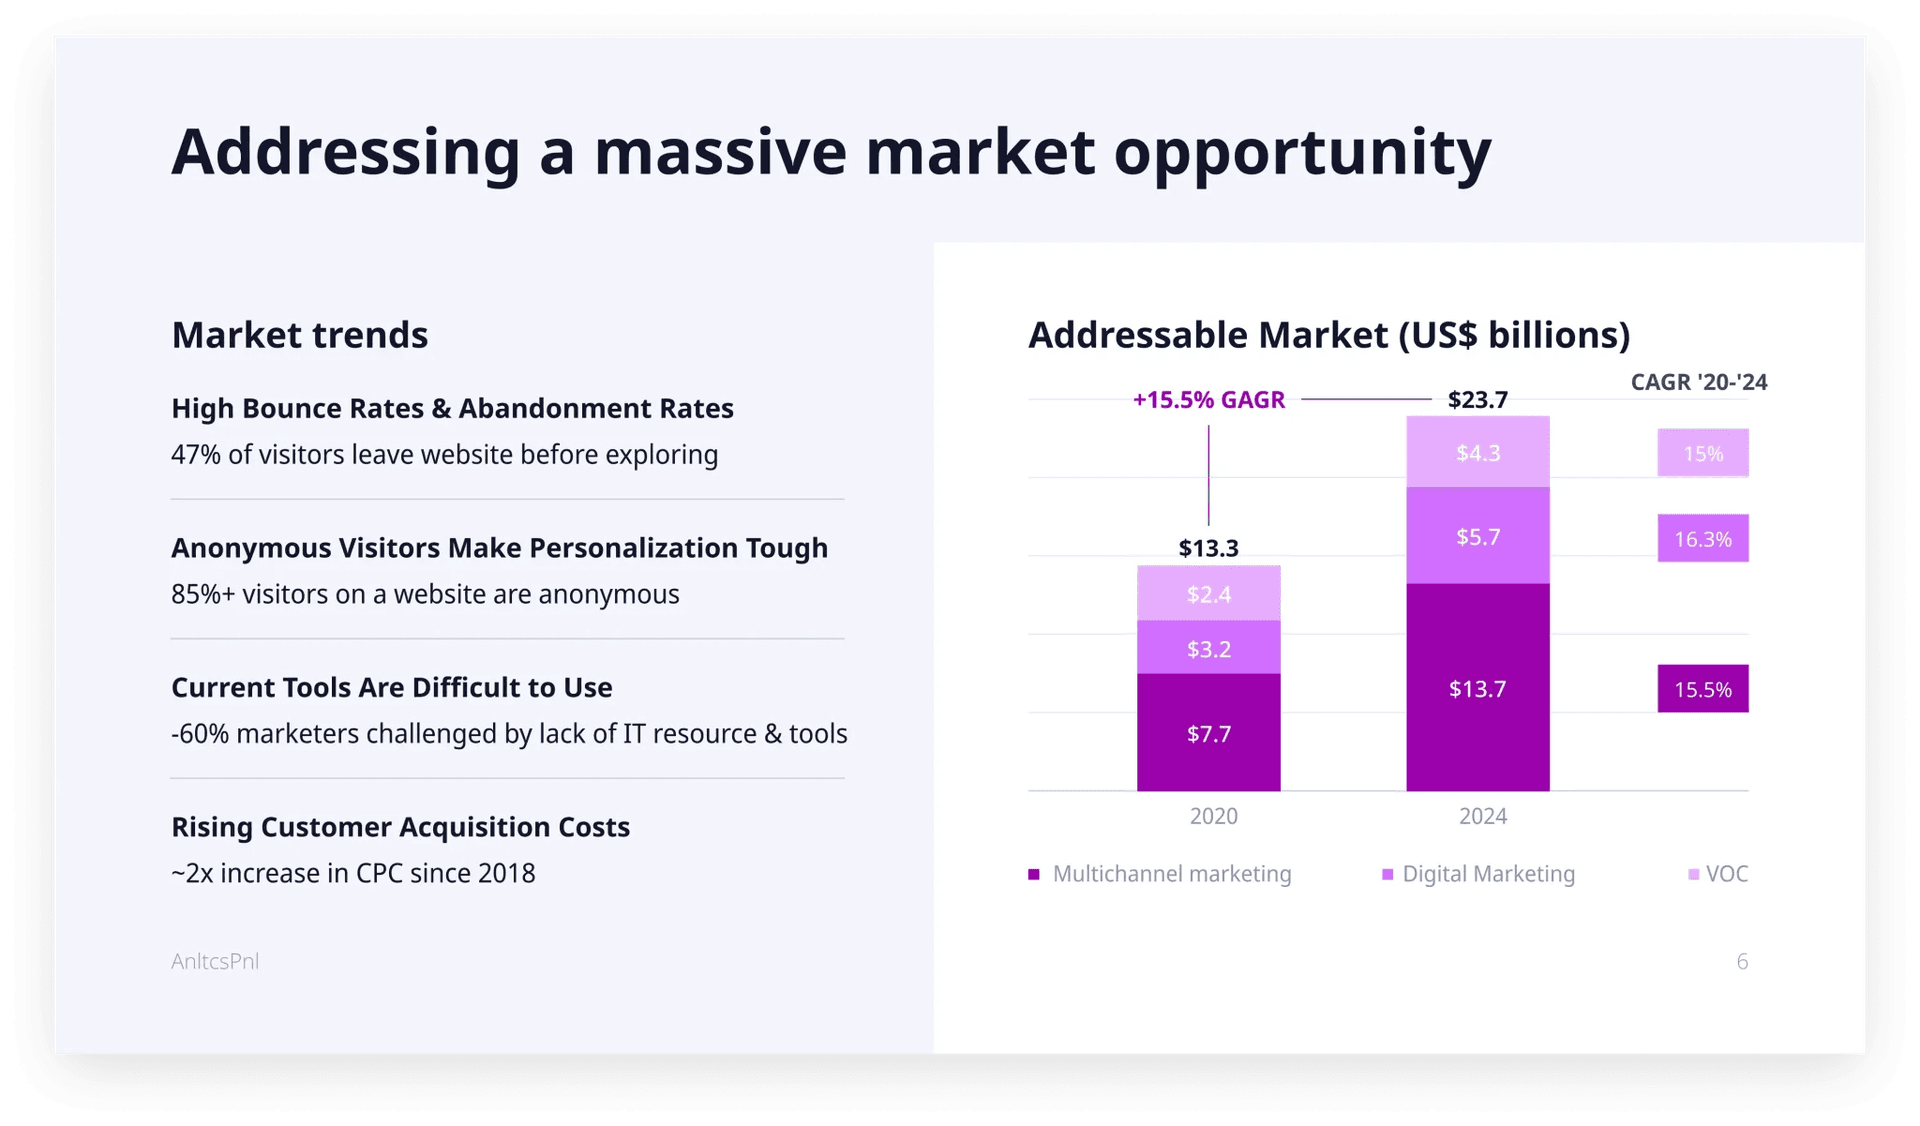
3. Top-down market size slide: quick, clear, and contextual
Top-down sizing works when you’re in a big, well-mapped market and need to show the scale fast. You start with the total industry size, then narrow to the segment you’re targeting.
The key here is clarity. Pull numbers from credible sources. Break the logic down cleanly. Add growth rates or trend lines if they help tell the story.
This approach is about setting the context. It works best when you’re pitching in a crowded space, laying the groundwork before you zoom in on how your product wins.
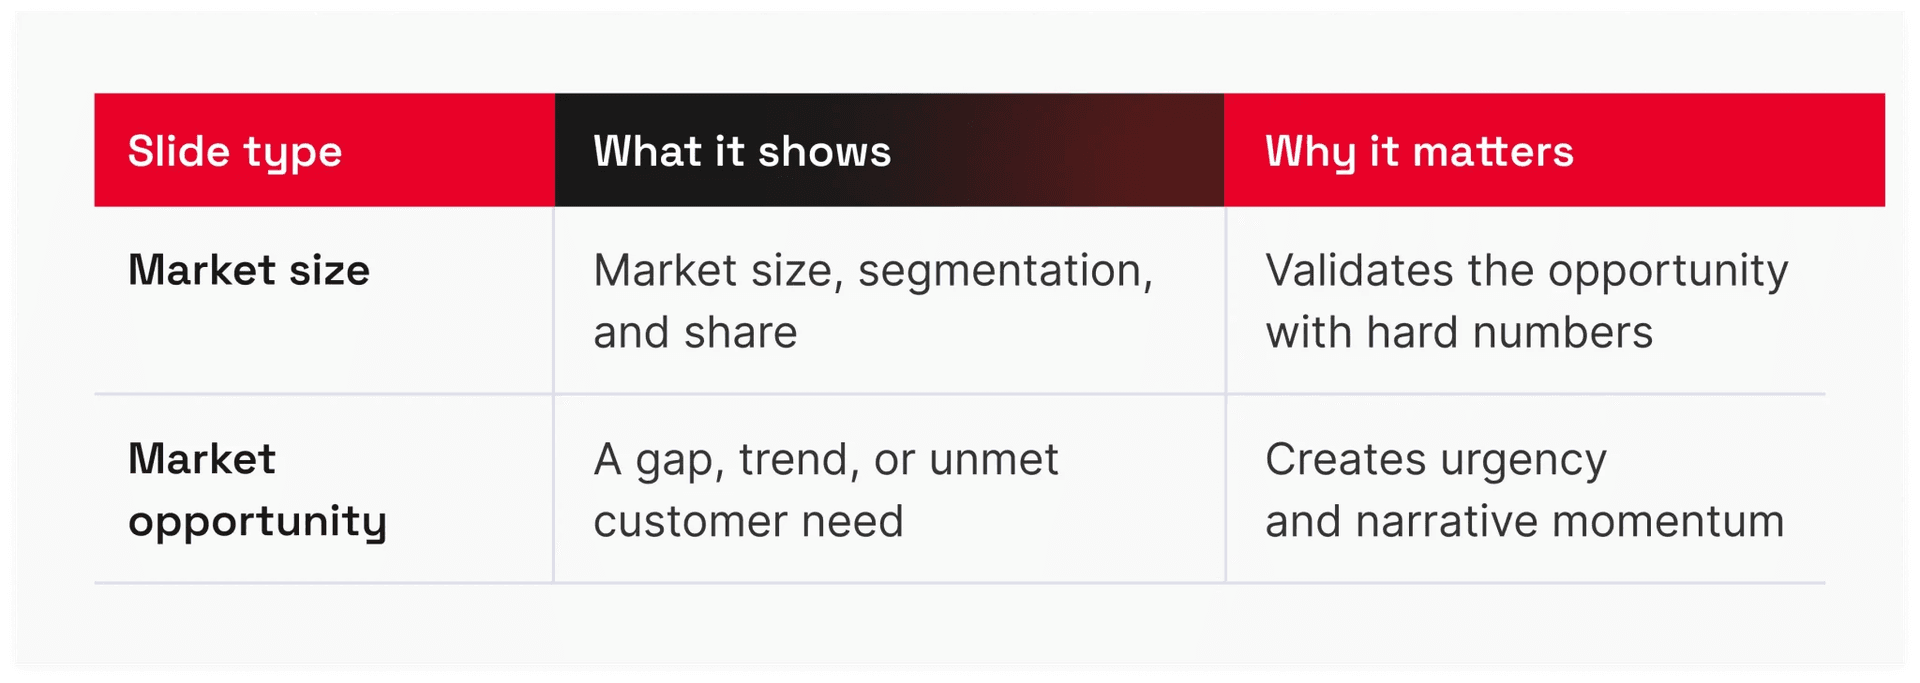
Market size slide vs market opportunity slide
Many founders confuse these two slides, but they actually serve a different purpose in your deck and answer different investor questions.
So, your market opportunity slide sets the context: why this market is worth entering, what’s shifting, and where the unmet demand is. It’s about timing and insight.
The target market slide is your proof: it shows the commercial upside, defines your playing field, and quantifies how big the win could be.
The best practice is to use them in sequence:
- Opportunity slide → “This market is broken or ripe for change.”
- Market size slide → “Here’s how big it is and how we’re going to win it.”
Final words
A strong market size slide tells investors you’ve done your homework, understand your market, and have a realistic shot at building something big. Whether you’re tackling a legacy industry or defining a new category, the right sizing framework turns ambition into a strategy.
And remember, here it’s not about showing the biggest number; it’s about showing the right one, backed by logic, data, and execution insight.
Need help turning your market data into a slide investors actually care about? Pitchili builds pitch decks that get read and funded. Reach out to us for assistance.
Related read: How to create a killer market opportunity slide (with examples)
FAQ
A market size slide shows investors how big the market opportunity is. It typically quantifies the total addressable market (TAM), the portion your business can serve (SAM), and what you can realistically capture (SOM). This slide helps prove the scale, growth potential, and investment upside of your business.
To calculate market size for your pitch deck, you can use either a bottom-up or top-down approach. Bottom-up starts with your SOM (what you can realistically capture), and then scales up to SAM and TAM. Top-down begins with broad industry data and narrows to your segment. In this case, it’s important to use credible sources and grounded assumptions.
You can show market size in your deck using a TAM-SAM-SOM framework, a top-down segmentation, or a greenfield sizing model for emerging markets. Visuals like tiered charts, bar graphs, or concentric circles work best. Keep your slide simple, data-backed, and focused on how your startup fits into the bigger market story.