Written by: Igor
Published: December 2025
Manufacturing runs on tight margins. Every minute of unplanned downtime, every scrapped part, and every late shipment chips away at your bottom line. Many founders and operators are sitting on mountains of data from their factory floors but struggle to turn it into actionable insights. This guide cuts through the noise and shows you how to use analytics for manufacturing to boost efficiency, slash costs, and get more product out the door. You’ll learn the four levels of analytics, see high-impact use cases like predictive maintenance, and get a practical roadmap to get started.
Snapshot: Your guide to manufacturing analytics
- Move from reactive fixes to proactive strategy by predicting failures before they happen.
- Climb the four levels of analytics: descriptive, diagnostic, predictive, and prescriptive.
- Start with a focused pilot project on a high-impact problem to prove value quickly.
- Build your business case around clear metrics like OEE, scrap rates, and maintenance costs.
- Avoid common pitfalls like unclear goals, poor data quality, and a lack of shop-floor buy-in.
Why analytics in manufacturing is no longer optional
Manufacturing isn't just about making things-it's about making them smarter. With rising material costs, fragile supply chains, and demanding customers, operators need a new edge. That edge is data. The companies pulling ahead are the ones that have stopped guessing and started measuring.
This is the real-world application of the "smart factory," or industry 4.0. It's not a far-off concept anymore. It’s the practical reality where every machine, sensor, and process is a source of valuable information. By tapping into this data, you can pinpoint exactly where inefficiencies are hiding, what’s causing production bottlenecks, and how to get the most out of every resource.
From reactive fixes to proactive strategy
For decades, manufacturing has been a reactive game. A machine breaks down, you fix it. A batch fails quality control, you scrap it and start over. That approach is expensive, unpredictable, and outdated. Analytics flips that entire model on its head.
Instead of just waiting for things to go wrong, you can:
- See equipment breakdowns coming. By analyzing sensor data like vibration and temperature, you can schedule maintenance before a critical failure occurs.
- Stop quality defects in their tracks. Real-time monitoring of process variables lets you catch tiny deviations instantly, preventing an entire batch from being ruined.
- Dial in your inventory levels. Use demand forecasting to avoid overstocking (which ties up cash) or stockouts (which kill sales).
This data-driven approach takes the guesswork out of the equation and replaces it with predictable, strategic success. To really grasp its power, you need to understand how analytics for manufacturers turns data chaos into profit by cutting waste and predicting downtime.
The market’s explosive growth tells the rest of the story. The manufacturing analytics market is set to jump from $13.97 billion to $16.79 billion in just one year, a stunning compound annual growth rate (CAGR) of 20.2%, according to Statista. This isn't just hype; it's a direct response to the urgent need for operational efficiency.
Experts are forecasting the market will swell to $40.9 billion by 2029. That kind of growth shows that analytics is no longer a "nice-to-have"-it's a core business function. For manufacturers today, this isn't just about innovation. It's about survival.
Understanding the four levels of manufacturing analytics
Not all data insights are created equal. To build a truly smart factory, you need to climb the analytics maturity curve, moving from basic reports to automated, strategic decisions. This journey plays out across four distinct levels of analytics for manufacturing.
Thinking about this as a step-by-step progression gives you a solid framework for building your data strategy. It's not about jumping straight to complex AI; it's about building a strong foundation and adding new capabilities, one layer at a time. Each step delivers more value than the last.
This hierarchy shows how moving up the analytics ladder directly supports your business goals, taking you from just surviving to achieving sustainable growth and profit.
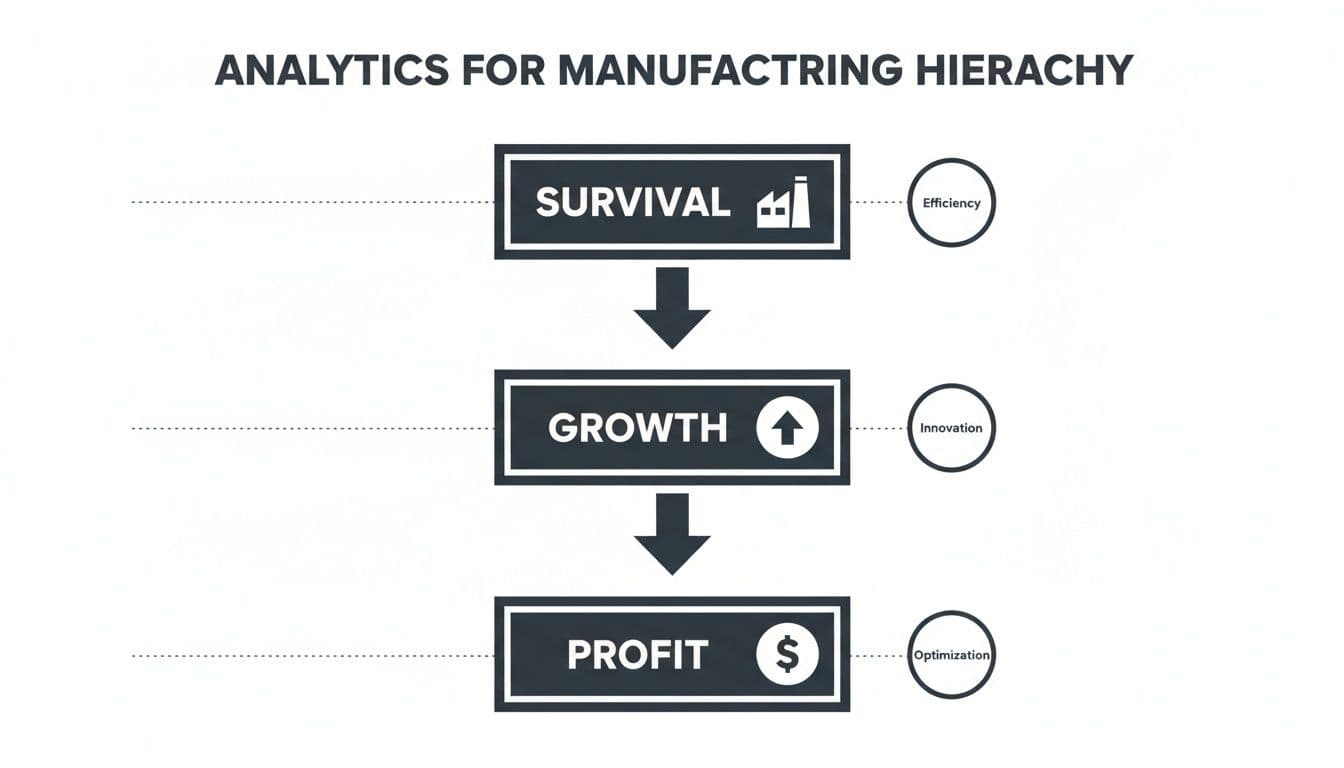
As you can see, basic operational efficiency is a survival-level game. Real growth and profitability come from the more advanced, data-driven innovation and optimization that analytics enables.
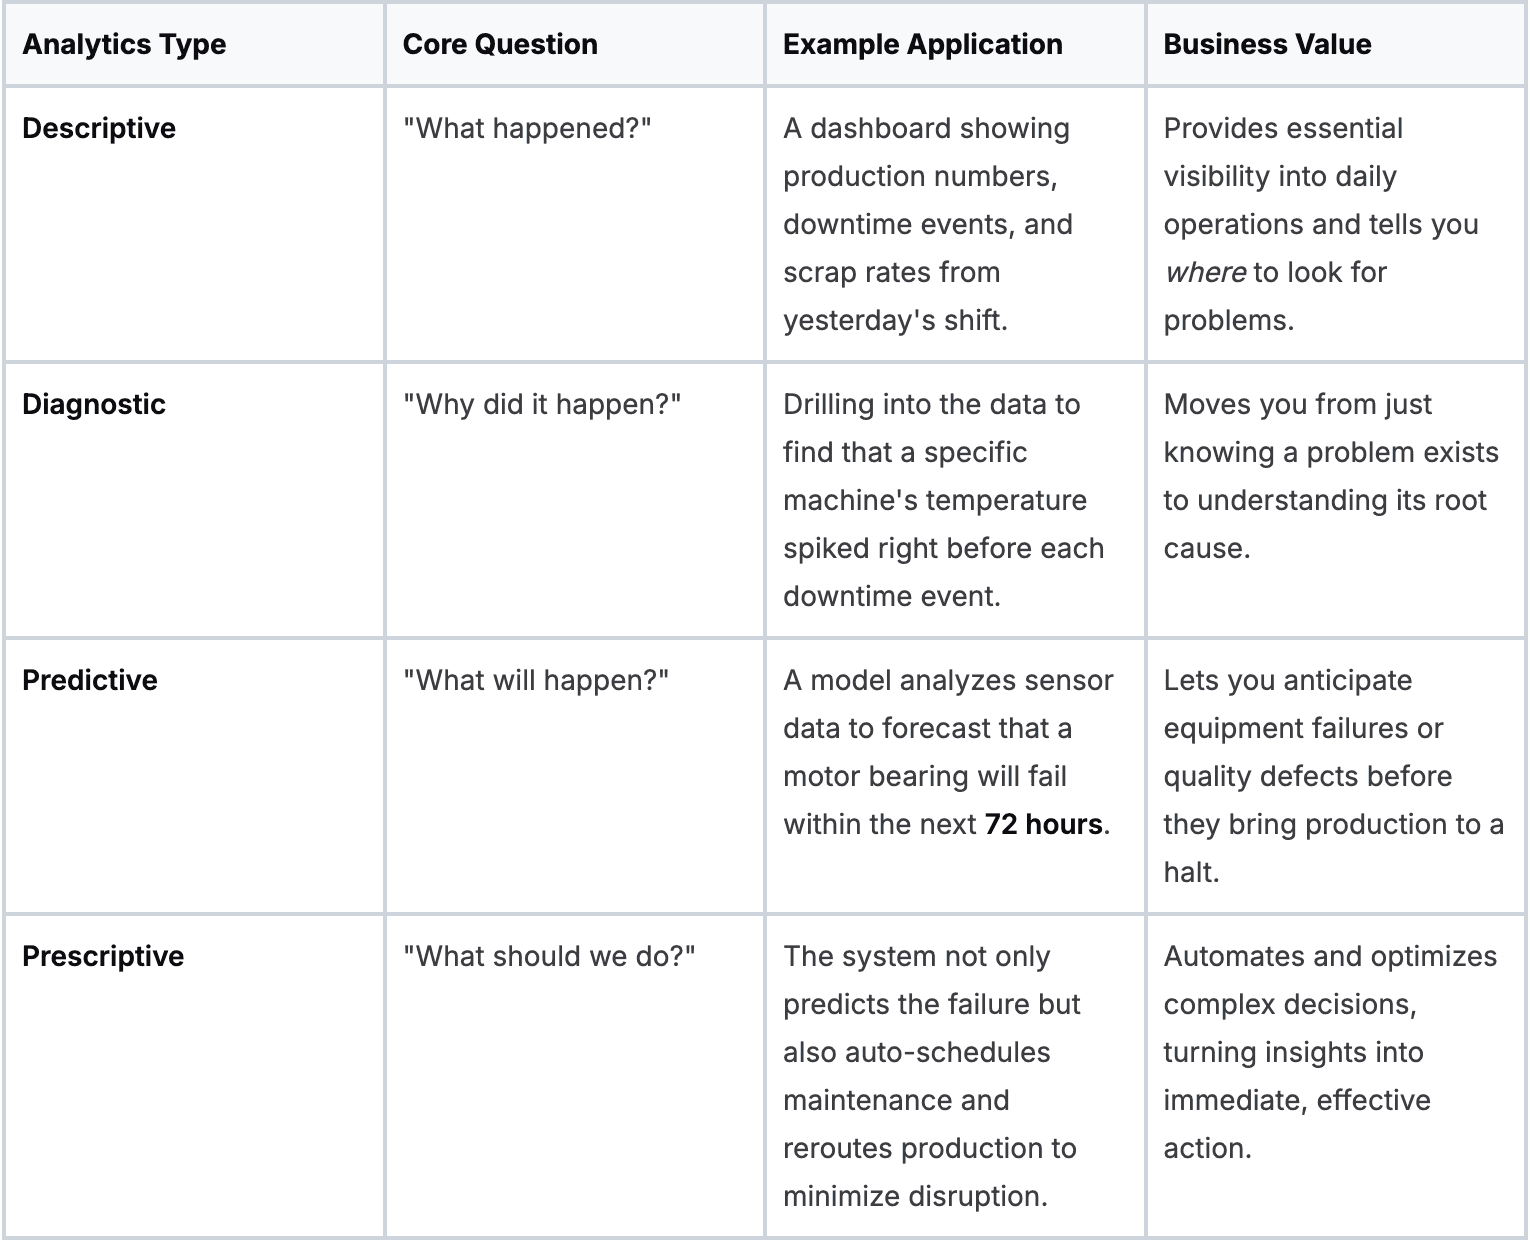
To make this crystal clear, let's break down the four types of analytics, what they do, and what they look like on the factory floor.
The analytics maturity model for manufacturing
Now, let's unpack each of these stages in more detail.
Descriptive analytics: what happened?
This is the most common starting point. Think of it as looking in the rearview mirror. Descriptive analytics summarizes past performance into something you can understand. It's your daily production dashboard, your scrap rate report, your Overall Equipment Effectiveness (OEE) chart.
It answers the simple but critical question: "What happened yesterday?"
- Example: A morning report shows that unit 3 produced 15% fewer parts than its target during the night shift.
- Business value: This gives you fundamental visibility. It tells you where to look for problems and whether you're hitting your targets. Without this baseline, you're flying blind.
Diagnostic analytics: why did it happen?
Once you know what went wrong, the next question is why. This is where diagnostic analytics comes in. It's the investigative work for your production line. You’re no longer just looking at a number; you're digging into the data to find the root cause.
This involves drilling down, correlating different variables, and connecting the dots between an outcome and its triggers.
- Example: You see the production drop on unit 3. A diagnostic analysis reveals that the machine’s motor temperature spiked three times during the shift, and each spike lines up perfectly with a brief shutdown.
- Business value: This is a huge leap forward. You move from simply knowing there's a problem to understanding its source. Now you can fix the actual issue instead of just patching up the symptoms.
Predictive analytics: what will happen?
This is where you shift from being reactive to proactive. Predictive analytics uses historical data, statistical models, and machine learning to forecast what’s likely to happen next. It's your factory’s early warning system.
Instead of just analyzing the past, you're now using that data to make an educated guess about the future. According to McKinsey, this proactive approach can reduce machine downtime by 30-50% and increase throughput by 10-30%.
- Example: A predictive maintenance model constantly analyzes the temperature and vibration data from unit 3. It predicts with 95% confidence that a key bearing will fail within the next 72 hours.
- Business value: This is a game-changer. You can anticipate equipment failures, supply chain hiccups, or quality defects before they happen, saving a massive amount of time and money. If you're curious whether your data is ready for this step, our guide to building an AI readiness assessment is a great place to start.
Prescriptive analytics: what should we do about it?
This is the highest level of analytics maturity. If predictive tells you what’s coming, prescriptive tells you the best thing to do about it. It acts like a strategic co-pilot, running through different scenarios and recommending the optimal move.
These advanced systems can simulate the impact of various actions and recommend the one that best aligns with your goals, whether that’s maximizing output, cutting costs, or reducing waste.
- Example: The system doesn’t just predict the bearing failure on unit 3. It automatically generates a work order, checks maintenance staff schedules, and confirms the replacement part is in stock. It then suggests rerouting production to other lines to keep the factory running smoothly while the repair is made.
- Business value: This is where you get a real competitive edge. It automates and optimizes incredibly complex decisions, ensuring you take the most efficient and effective action every single time.
Putting analytics to work with high-impact use cases
Theory is great, but results are what matter. Now that we’ve walked through the four levels of analytics, let’s get practical and see how they deliver value. This is where we move from concepts to cash flow, focusing on real-world applications that solve some of the most expensive problems in manufacturing.
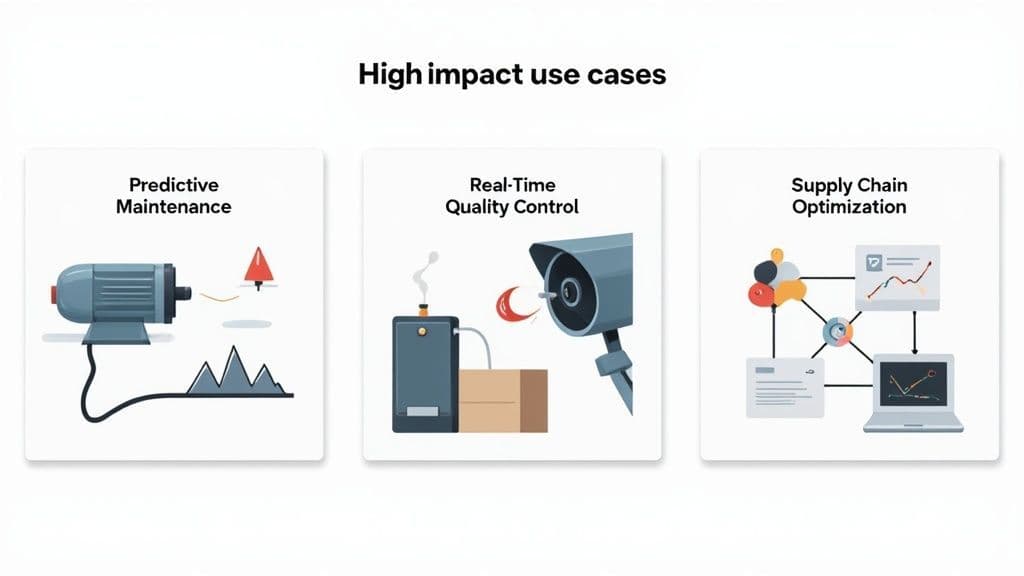
By applying analytics for manufacturing to a few specific, high-impact areas, you can generate a clear and rapid return. We’ll dig into three of the heaviest hitters: predictive maintenance, real-time quality control, and supply chain optimization. Each one tackles a common operational headache with a powerful data-driven solution.
Predictive maintenance prevents costly downtime
Unplanned downtime is the silent killer of profitability. When a critical machine fails without warning, the entire production line grinds to a halt. This can cost thousands of dollars per hour in lost output, overtime, and emergency repairs. Predictive maintenance flips the script from reactive fire-fighting to proactive prevention.
Instead of waiting for something to break, this approach uses sensor data-think vibration, temperature, and pressure-to constantly monitor equipment health. Machine learning models then analyze these data streams, hunting for the subtle patterns that indicate an impending failure.
The business impact is immediate. According to a Deloitte report, companies that get this right see a 10-20% reduction in maintenance costs and a 5-10% increase in equipment availability. It all comes down to scheduling maintenance precisely when it's needed, which extends the life of your assets and keeps them running at peak productivity. It's one of the most powerful applications of analytics, as detailed in this guide to predictive maintenance in manufacturing.
Real-time quality control catches defects instantly
Scrap, rework, and customer returns are massive drains on your bottom line. Traditional quality control often relies on manual spot checks at the end of the line, meaning defects are usually caught long after the damage is done. By then, you might have already produced an entire batch of bad parts.
Real-time quality control builds quality assurance directly into the production process itself. Here’s how it works:
- AI-powered vision systems: High-speed cameras paired with AI can visually inspect every single product on the line. They spot microscopic defects a human inspector would easily miss.
- Process parameter monitoring: Sensors track variables like temperature, pressure, and mix consistency in real time. Analytics models can flag tiny deviations from the ideal "golden batch" parameters before they result in a flawed product.
This proactive approach dramatically boosts first-pass yield-the percentage of products made correctly the first time. It cuts waste, slashes costs, and protects your brand by ensuring only top-quality goods leave the building.
Supply chain optimization builds resilience
If the last few years have taught us anything, it's just how fragile supply chains can be. A single delayed shipment can trigger a cascade of production stoppages. Analytics can transform your supply chain from a reactive cost center into a resilient, strategic asset.
This works by zeroing in on two key areas: demand forecasting and inventory management. By analyzing historical sales data, market trends, and even external factors like weather, predictive models can forecast future customer demand with up to 85% greater accuracy.
This insight lets you align your production and purchasing with what the market actually wants. The result is a finely tuned balancing act:
- You hold just enough inventory to meet demand without tying up cash in your warehouse.
- You avoid costly stockouts that lead to lost sales and frustrated customers.
- You get the foresight to spot potential supplier disruptions and make a plan B.
By optimizing these critical functions, manufacturing analytics helps you build a more agile and robust operation that can weather uncertainty and consistently deliver for your customers.
Building a solid data foundation for your factory
World-class analytics starts with a world-class data foundation. Before you can predict machine failures or fine-tune product quality, you need a reliable, unified flow of information from every corner of your operations. This is your guide to building the technical backbone your factory needs for powerful analytics for manufacturing.

Think of it like building a city’s water system. You've got reservoirs, rivers, and wells, but none of that water is useful until it’s collected, cleaned, and piped exactly where it's needed. Right now, your factory's "water" is its data, and it's probably trapped in disconnected systems.
Unifying your core data sources
Your factory is already a data-generating machine. The problem? That data is usually stuck in silos, making it nearly impossible to get the full picture. A solid foundation means tearing down those walls and pulling information from a few key places:
- Manufacturing Execution Systems (MES): This is mission control for your shop floor. It tracks everything from work orders and production schedules to who's working on what machine.
- Supervisory Control and Data Acquisition (SCADA): These systems are your real-time eyes and ears, giving you live data from industrial controls-think temperature, pressure, and flow rates.
- Enterprise Resource Planning (ERP): Your ERP provides the business context. It holds all the info on inventory, supply chains, customer orders, and the financials behind it all.
- IoT sensors and devices: Modern sensors add a whole new layer of high-frequency data, tracking machine vibrations, energy use, and even environmental conditions on the floor.
When you bring these sources together, you create a single source of truth. Suddenly, you can connect a machine's performance (from SCADA) to the specific product it's making (from MES) and its final cost and profitability (from ERP). That’s where the magic happens.
Breaking down silos with a unified architecture
To make that unified view a reality, you need a central place to put all this data. This usually looks like a data lake or a data warehouse. While they have their technical differences, they solve the same fundamental problem: they give you one spot to store, process, and analyze all your manufacturing data.
This central hub ensures clean, reliable information can flow to whoever needs it, whether that’s a shift supervisor looking at a simple dashboard or a data scientist building a complex machine learning model. It’s the infrastructure that makes advanced analytics possible. An essential first step is figuring out if your current setup is even ready for this. You can learn how to evaluate your current systems with an AI readiness assessment.
Edge vs. cloud computing: where to process your data
Another big architectural decision is where the data processing happens: on the "edge" (right there on the factory floor) or in the cloud. This isn't an either/or choice; the best approach usually blends both.
- Edge computing: This means processing data directly on or near the machine that's creating it. It’s perfect for anything that needs an instant response. Think of an AI-powered camera spotting defects on a fast-moving conveyor belt-it has to make a split-second decision. Sending that data to the cloud and back would be too slow.
- Cloud computing: Here, you send data to a central cloud platform for the heavy lifting-analysis and storage. This is where you’d build complex predictive models that need to chew on massive amounts of historical data from across the entire factory.
Your strategy all comes down to the use case. For immediate, on-the-spot operational decisions, edge computing is king. For deep, strategic analysis that informs long-term planning, the cloud gives you the raw power and scale you need.
North America is leading the charge in adopting these hybrid models, with its manufacturing analytics market valued at $4.63 billion and projected to hit $17.50 billion by 2034. You can read more on this growth from Precedence Research. This kind of investment is setting a new global standard for what a truly effective data infrastructure looks like.
Your roadmap from first pilot to full-scale production
The journey to a smart factory starts with a single step, not a giant leap. Trying to overhaul everything at once is a recipe for frustration and budget overruns. The real key to success with analytics for manufacturing is to start small, prove value fast, and build momentum from there.
This four-stage roadmap is a practical guide to get you from that first experiment to a fully scaled, data-driven operation.
Launch a focused pilot project
Your first project needs to be a quick, decisive win. The goal isn’t to solve every problem in the factory; it’s to fix one important problem and show everyone this new approach actually works. Look for a project that's high-impact but low-risk.
Often, the perfect candidate is a single, notorious bottleneck machine. You know the one-it’s the machine that always seems to gum up the works and cause headaches for the whole line. By focusing your efforts here, you can deliver a clear, measurable improvement that gets people talking.
Here’s a quick checklist for picking your pilot:
- Is the problem well-defined? Focus on something specific, like "reduce unplanned downtime on CNC mill #5," not a vague goal like "improve efficiency."
- Is the data available? Make sure you can get the data you need from the machine’s sensors or control systems without a massive, months-long integration project.
- Is the impact measurable? You have to be able to quantify the "before" and "after." Track metrics like downtime hours, OEE, or scrap rate.
- Is the solution visible? Pick a problem that operators and managers actually care about. A win here will build the buy-in you need for everything that comes next.
Assemble your core team
You don't need a huge data science department to get this off the ground. Your initial team should be a small, agile group that combines deep operational know-how with the right technical skills. Think of them as a "tiger team" that will drive the pilot and become champions for this new way of working.
Your core team should include:
- An operations expert: This is someone straight from the shop floor-a line supervisor, a senior engineer, or a maintenance lead. They understand the process inside and out and provide the context that data alone can never give you.
- A data implementer: This is the person who's comfortable getting their hands dirty with data. They could be an IT specialist, a process engineer with some scripting skills, or an external partner who can connect to the data, clean it up, and get the analytics tools running.
- An executive sponsor: You need a leader who can clear roadblocks, secure a modest budget, and champion the project's value to the rest of the C-suite.
This lean structure keeps the project grounded in real-world factory challenges while giving it the technical and organizational muscle it needs to succeed.
Measure and iterate relentlessly
From day one, you must define what a "win" looks like for your pilot. Vague goals just lead to vague results. Settle on a handful of clear Key Performance Indicators (KPIs) that directly tie back to the problem you're trying to solve.
For a predictive maintenance pilot, your KPIs might look something like this:
- Reduction in unplanned downtime: Aim for a specific target, like a 20% decrease in the first three months.
- Increase in Mean Time Between Failures (MTBF): Track how much longer the machine runs without a hitch.
- Operator feedback score: Get qualitative input from the team on the floor. Do they find the new alerts useful and actionable?
Once the pilot is live, your job is to listen and learn. Hold regular check-ins with the operators. Are the alerts helpful? Are they coming too early, too late, or just right? Use this feedback to constantly fine-tune your models. This iterative loop of measure-learn-refine is what turns a good idea into a great operational tool.
Scale with confidence
Once your pilot has delivered clear, undeniable results, you have a success story to tell. Now it’s time to use that momentum to scale up. Your pilot is the blueprint.
Scaling doesn’t mean boiling the ocean. It means methodically rolling out your proven solution to other similar machines, then to other lines, or even to entire facilities. You’ve already navigated the initial AI implementation challenges, so the process gets faster and more predictable with each step.
Document everything you did in the pilot, create standard operating procedures, and use your success story to build a rock-solid business case for broader investment. This is how you transform a single win into a factory-wide capability.
How to measure ROI and avoid common implementation pitfalls
An analytics project without a clear return on investment (ROI) is just an expensive science experiment. To get the business to back your work, you have to prove that what you're doing hits the bottom line. Forget the technical jargon and focus on the financial outcomes that leadership cares about.
Measuring the real value of analytics for manufacturing means tying every project directly to core operational KPIs. It's easy to get lost in the weeds of model accuracy, but the real win is tracking the impact on efficiency, waste, and cost out on the factory floor.
Calculating your financial return
The best way to show your work is valuable is by connecting your pilot project to cold, hard cash. Zero in on a few high-impact areas where improvements are simple to quantify.
Here are three solid metrics to build your ROI case around:
- Overall Equipment Effectiveness (OEE): This is the champion for measuring manufacturing productivity. If your predictive maintenance pilot cuts unplanned downtime by just 10% on a bottleneck machine, that's a direct boost to OEE and throughput.
- Scrap and rework rates: A real-time quality control system that spots defects before they become big problems can slash your scrap rate. Imagine your pilot drops scrap from 3% to 2% on a high-volume line. The savings in materials and labor start to add up almost immediately.
- Maintenance costs: When you shift from reactive repairs to planned, proactive maintenance, your costs plummet. You can track the drop in overtime labor, rush shipping for parts, and the simple fact that your critical assets last longer.
Put a dollar value on these gains, and you've got an undeniable business case for taking your project to the next level.
Steering clear of common pitfalls
Even with a crystal-clear ROI target, many analytics projects go off the rails because of a few common, avoidable mistakes. Knowing what these are ahead of time is half the battle. If you're just getting started, our guide on how to implement AI in business provides a great foundational framework.
Here are the top three traps and how to sidestep them:
- Setting unclear or overly ambitious goals: Trying to "optimize the entire factory" is a guaranteed way to fail. Vague goals make it impossible to know if you've succeeded and leave your team spinning their wheels.
- The fix: Start small and get specific. Instead of a fuzzy objective, set a sharp target like, "reduce unplanned downtime on assembly line 3 by 15% in the next quarter." Suddenly, everyone knows exactly what the finish line looks like.
- Tolerating poor data quality: Your analytics are only as reliable as the data feeding them. If your sensors and systems are spitting out incomplete, inconsistent, or just plain wrong data, you’ll end up with junk models and flawed insights.
- The fix: Make data hygiene a non-negotiable from day one. Run a data audit before you launch a pilot. Find the gaps, fix the messy stuff, and set clear standards for how data will be collected from now on. A little bit of cleanup work upfront pays for itself ten times over.
- Failing to get shop-floor buy-in: The fanciest system in the world is worthless if the operators and maintenance techs on the floor don't trust it or refuse to use it. Ignoring their experience is the fastest way to kill your project.
- The fix: Bring the end-users into the project from the very beginning. Make them part of the pilot team. Ask them what problems are most painful and how the tool could actually make their jobs easier. When they see it as their tool, they won't just use it-they'll become its biggest champions.
What's next for your manufacturing analytics journey?
You now have a framework for turning your factory’s data into a competitive advantage. The key is to move from theory to action. Don't wait for the perfect, all-encompassing strategy. Instead, identify one high-impact problem you can solve in the next 90 days. Proving the value of analytics for manufacturing with a single, successful pilot is the most powerful way to build momentum and secure the resources needed to scale.
We at N² labs can help you build the foundation for data-driven manufacturing. Our expert guidance ensures you focus on the projects that deliver the most value, turning your data into a durable competitive advantage. Find out how we can help you scale with confidence.
FAQ
The best way to start is to pick a single, high-impact problem and solve it with a focused pilot project. Think about one critical machine that causes recurring downtime or a nagging quality control issue. Solving one specific, painful challenge proves the value of analytics for manufacturing quickly and builds the momentum you need to scale across the factory.
You probably need less than you think to get started. In many cases, a few solid months of historical data from a single asset is enough to build an initial model that delivers real value. This typically includes sensor readings (like temperature and vibration) and your maintenance logs. The most important thing is to start collecting high-quality, relevant data from your most critical equipment now.
Absolutely. This isn't just for big players anymore. Modern cloud platforms and affordable IoT sensors have put powerful analytics within reach for businesses of all sizes. Small and medium-sized manufacturers can use these tools to zero in on specific problems and see a significant return on their investment without needing a huge, in-house data science team.
A classic example is predictive maintenance. Instead of waiting for a machine to break down, sensors collect data on vibration and temperature. An analytics model analyzes this data to predict a failure before it happens, allowing the maintenance team to schedule a repair during planned downtime. This prevents costly production halts.
The four types represent a maturity curve. They are: 1) Descriptive analytics (what happened?), which provides basic reports. 2) Diagnostic analytics (why did it happen?), which uncovers root causes. 3) Predictive analytics (what will happen?), which forecasts future events like machine failures. 4) Prescriptive analytics (what should we do?), which recommends optimal actions.